
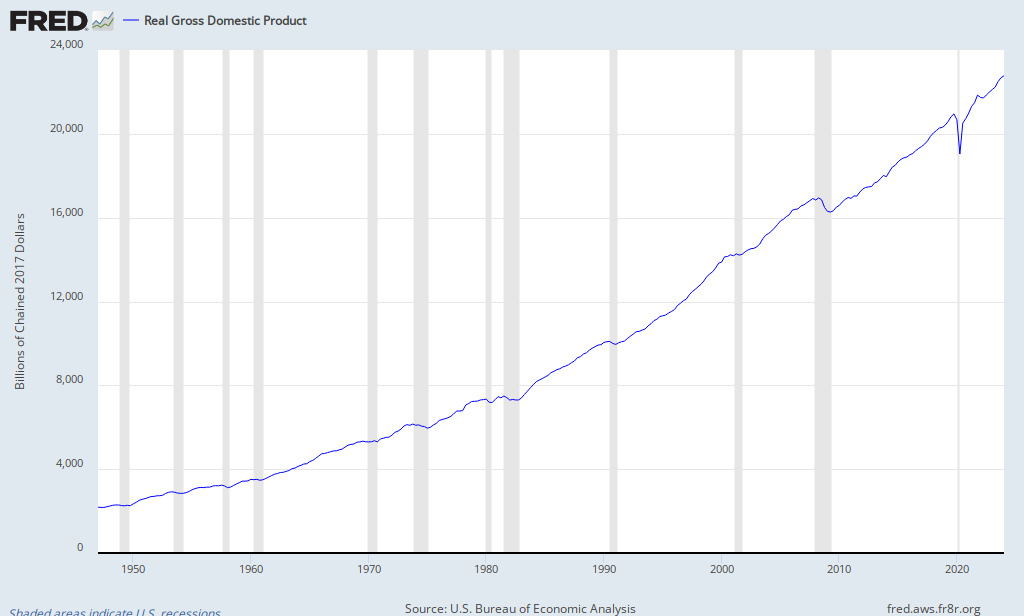
Let’s see what happens if we take (a) total government and (b) federal government expenditures, and divide by actual GDP, not “potential” GDP. We find this:

So granted, despite a relentless decline in total and federal expenditures per dollar of GDP (and a lot of the stimulus increase just filling the hole that the states were digging), government spending per dollar of GDP is the highest it's ever been. Agreed. But if you're using that metric then how can you conclude that "the economy right now is arguably worse than it was during the Great Depression", as Bob does? If you are assessing policy based on levels of government spending and levels of GDP, shouldn't you be measuring performance based on levels too? That also seems to be the highest it's ever been:Huh, how ’bout that? According to this metric, government spending (whether total or just federal) is still higher than at just about any point in the last 50 years, save for the crisis period itself and a few little blips. Couple that with the fact that the economy right now is arguably worse than it was during the Great Depression–both DeLong and Krugman tell us this is so–and it’s a good prima facie case that massive government spending hurts the economy. That should make sense, because it lines up perfectly with commonsense “micro” thinking.
Can someone please explain what Bob Murphy is doing here? It makes no sense to me.
It seems like we should be talking about rates of change, not levels. And it seems to me we should be comparing to a counter-factual of some sort (the output gap), which is precisely what he criticizes as "loading the deck". I don't see how identifying a counterfactual is loading the deck - that's the only way to do good science.
If Bob wants to cite or write up a literature on a persuasive alternative counterfactual that's one thing.
But don't imply that the extant literature is cheating. It's essential to making any scientific claim and it appears to be the most persuasive argument.
This is just like David Henderson's accusation of "proof by assumption". Suddenly going with the extant literature becomes tantamount to cheating - "loading the deck". Why? It seems like a weighty accusation to accuse another analysis of cheating. It seems like you have to have a better case than this if you're going to do that.


It's silly for us to get hip-deep into this, but very quickly: I didn't look at the level of government spending in absolute dollars, I looked at the level of government spending as a share of actual GDP.
ReplyDeleteWhich is what I said in the post, right?
DeleteBut if we're looking at levels shoudln't we be consistent about that?
Ultimately it's questionable whether we should be looking at levels, though. The theory we're grappling with is about changes. Whether a particular level of government spending is consistent with a wealthy economy seems to me to be an entirely different question, and strongly contingent on the composition of government spending and relative demand for public and private spending.
Hang on, I should have said this instead:
ReplyDelete"This isn't a levels vs. rate thing. Krugman was looking at a level too--the level of government spending as a percentage of potential GDP. He said that that was lower than during the Reagan years, so right-wingers had no business blaming the bad economy on government spending. I pointed out that if we just switched the level-measure we were using, in a way I found very reasonable, we get the opposite result, namely that government spending is currently the highest since the 1950s, save for the crisis period and a few blips."
So unless you are baffled as to why Krugman was using levels in his analysis, you shouldn't be with me, either.
Daniel: it is a mistake to legitimize Murphy by engaging with him. If Murphy was even partially serious in his argument, he would have extended his chart back to 1940 or earlier.
ReplyDeleteObviously we have GDP and government estimates that go back further, but the reason he doesn't have them is that he's using FRED series. I'm not going to blame him for not doing the leg work of constructing his own series, particularly since I don't see what it adds.
DeleteThe problem is that he is making an argument from comparing GDP and government spending that leaves out the Second World War. He is turning "Nelson's eye" to the actual historical record.
DeleteIt is a variant of the post hoc, ergo propter hoc fallacy, except that it is even worse. The claim is not that X came before Y, therefore X caused Y, it is that X came at the same time as Y, therefore X caused Y. To be sure, it is not a definitive claim of causation, it simply claims to be "a good prima facie case". It is an argument that a high school freshman might make. It is not even sophomoric.
ReplyDelete