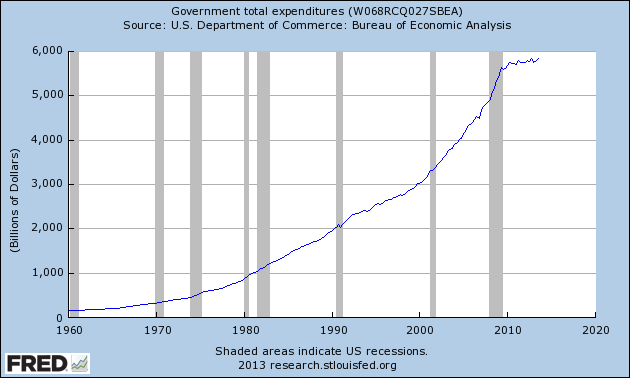
The post linked above is an excellent demonstration of the gaping chasm that exists between different peoples' interpretation of what's been going on. I sort of wish now I talked more about current events in my class. I talked about the evolution of growth theory and about the Lucas critique on the last two days of class, respectively, but I kind of wish I kept the Lucas critique and spent the other class period talking about the Great Recession and the policy response as they relate to Keynes and Hayek.
As it stands I was very skimpy on policy in the Hayek lecture and in the Keynes lectures. For Keynes we did an overview day, a day on consumption theory, a day on investment theory, and a day on interest rate theory - with some monetary policy discussion coming in on the interest rate theory day and a brief mention of fiscal stimulus on the consumption day when we derived the multiplier. Hayek didn't have any direct policy talk.
Perhaps this was a mistake.
This graph screams austerity but for some reason people are caught up on the fact that it did not actually decrease and ignoring the fact that the last five years look very, very different from the preceding fifty.


This comment has been removed by the author.
ReplyDeleteIndeed, right on all accounts. To shamelessly self-promote, I had a post looking at this earlier this year:
ReplyDeletehttp://squarelyrooted.com/2013/02/12/krugman-is-underselling-austerity/
Indeed, whether one wants to define it as a "collapse" or not, what is happening now is without postwar precedent except for the time we demobilized from Korea and had a recession at the same time.
No no no - don't you know that Bush Jr. restrained spending and the Kenyan socialist has allowed spending to spin out of control as part of his plot to steal our precious bodily fluids.
ReplyDeleteAnd we have always been at war with Eastasia.
And, unless I'm reading the chart labeling incorrectly, that's *nominal" spending. According to this chart (http://research.stlouisfed.org/fred2/series/GCEC96?cid=107), real government purchases of goods and services have been declining since the first quarter of 2010.
ReplyDeleteAnd the population has been growing so government spending per capita are falling even faster.
DeleteFor countries that have debts denominated in their own currencies, I don't think austerity is that big of a deal. The problem in Europe isn't really austerity; the problem is that half the countries in the Euro have debts denominated in a currency they can't control. For a country like the US, tighter fiscal policy and even a private sector deleveraging can be offset by some form of a currency devaluation. If you include federal, state, and local budget cuts, the austerity we've had here has actually been really large.
ReplyDeleteLooks like one of those rare cases of a counter cyclical policy.
ReplyDeleteIt doesn't "screm" austerity to me. I'm just going by the dictionary definition of "austerity" btw.
ReplyDelete